
The transport sector in India is the fastest growing source of carbon-emissions, with road transport contributing to 90% of the total emissions coming from this sector (Climate Action Tracker, 2020). A recent report capturing a pan-India survey to gauge climate change awareness reveals that 80% of Indians are aware of the impact of their choices on climate change (Ghosh, 2020) . While a significant number of us intend to adopt a low-carbon lifestyle, the thoughts rarely translate into action. Lack of suitable alternatives and awareness of these alternatives are key barriers that limit change to sustainable choices.
India’s automobile sector, however, is making progress in providing sustainable alternatives. The Indian electric vehicles (EV) market is experiencing rapid growth. The market which was valued at USD 5 billion in 2020, is expected to grow at a CAGR registering above 44%, to almost USD 47 billion dollars (Mordor Intelligence, 2021). India’s leapfrog from BS IV norms to BS VI norms reflects the government’s commitment to lowering emission impacts on the environment. With a domestic share of 80.83% of all motor vehicles present (SIAM, 2021), two-wheelers are a key segment for emissions control in India.
In order to enable a consumer translate their thought to action, it is necessary to aid them with selecting a sustainable vehicle choice within their individual preferences and constraints. The need of the hour is an avenue for consumers to select and compare their vehicle options, and the Green Vehicle Rating (GVR) tool is uniquely placed to address this gap.
What is GVR?
It is the country’s first vehicle rating system based on the vehicles’ environmental performance. It currently focusses on the two-wheeler segment spanning across electric and conventional fuel Internal Combustion Engine (ICE) vehicle models. The tool uses the government-mandated Form-22 vehicle emission document to source corresponding GHG emissions and criteria pollutant data. The associated health and environmental damage costs are calculated and presented in monetary terms to grade vehicles. Additionally, consumers can also compare vehicle models of their preference and make a better, greener vehicle choice.
How to access GVR?
The tool has its own website and can be accessed by doing a simple google search as well. Alternatively, the tool can be accessed by visiting the AEEE homepage and clicking on the weblink section.
Using GVR
The GVR website has been designed in a consumer-friendly manner. Similar to e-commerce websites, the GVR website provides filters for vehicle type (bike/scooter), price, and mileage/range, as illustrated in Figure 1.
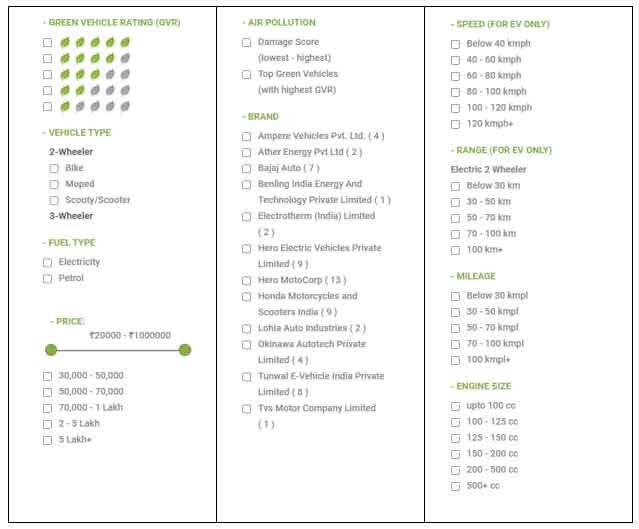 Figure 1: Filters present on the GVR website
What vehicle information does GVR offer?
While the technical specifications of vehicle models are available across multiple platforms, GVR is unique in quantifying the environmental performance of the consumer’s preferred vehicle. The damages to health and environment, associated with a particular vehicle model, are determined in monetary terms (₹/km). A Composite Damage Cost (CDC), which includes the total health and total environment damage cost, is calculated and added to the Total Cost of Ownership (TCO) of the vehicle to derive the Real Cost of Ownership (RCO). The RCO is a comprehensive total cost that considers the impact of consumer’s vehicle choices on their health and environment. The methodology associated with arriving at these costs has been captured in a detailed whitepaper. A sample from the GVR website is shown in Figure 2.
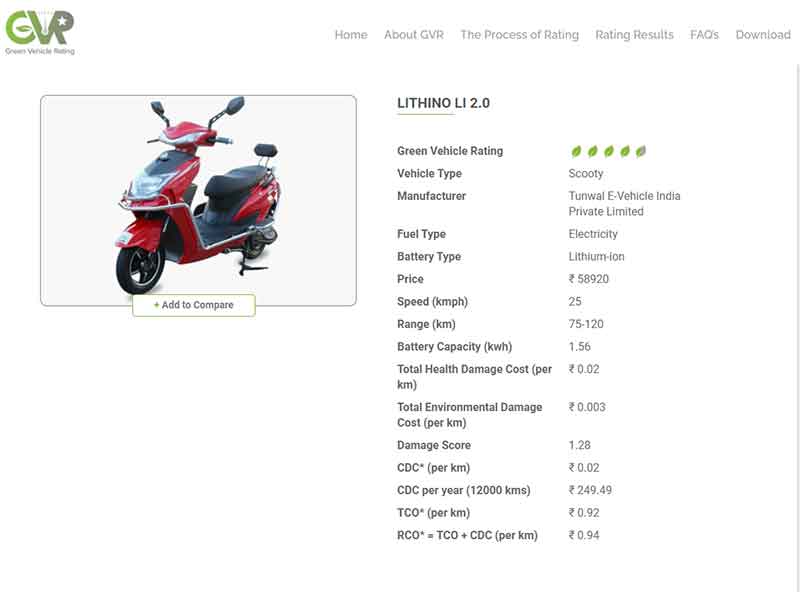 Figure 2: Snapshot of Vehicle details provided in GVR
Comparing Vehicles
GVR has a database of vehicle models from both ICE and EV fuel types. Using the compare vehicle feature situated at the bottom of the page (see Figure 3), consumers can compare the specifications and environmental performance of their prospective vehicle choices. GVR allows for ICE to EV, EV to EV, and ICE to ICE comparison. A snapshot of these comparisons is captured below:
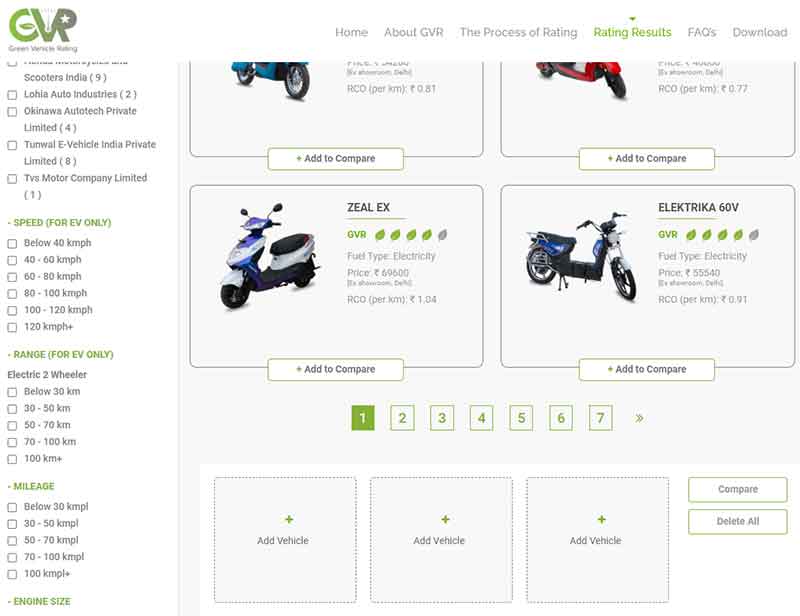 Figure 3: Compare vehicle feature on the GVR website
1. ICE vs. EV
While EVs are cleaner than ICE vehicles by virtue of their zero tailpipe emissions[ Emissions discharged through exhaust gases from the internal combustion engines.], they are not pollution free. Comparing the two vehicles gives the consumer a sense of how their preferred vehicle choice fares against a different fuel type, thus empowering them to take into account the environmental performance of their vehicle purchase. Figure 4 is a sample representation of ICE to EV comparison as seen on the GVR website. The associated vehicle costs are presented in parallel for the consumer to make an informed choice.
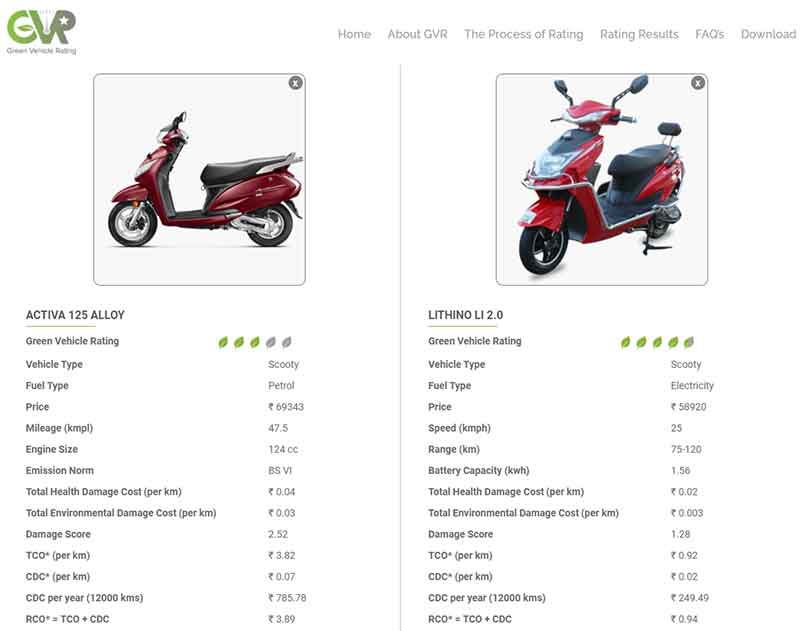 Figure 4: Snapshot of ICE to EV comparison in the GVR website
2. EV vs. EV
In a comparison of on-road presence, ICE vehicles outdo EVs by a large margin. When a consumer is looking to purchase an ICE vehicle, there are ample sources for him to gather feedback before committing to the sale. Word-of-mouth, established ICE dealerships and the sheer number of ICE vehicle owners allow the consumer to grasp necessary information regarding the vehicle they intend to purchase. However, the EV segment is relatively nascent, and the avenues for sourcing information on these vehicles is limited. By allowing consumers to compare EVs, GVR enables them to make an informed choice. Figure 5 is a sample representation from the GVR website where consumers can pick their right EV.
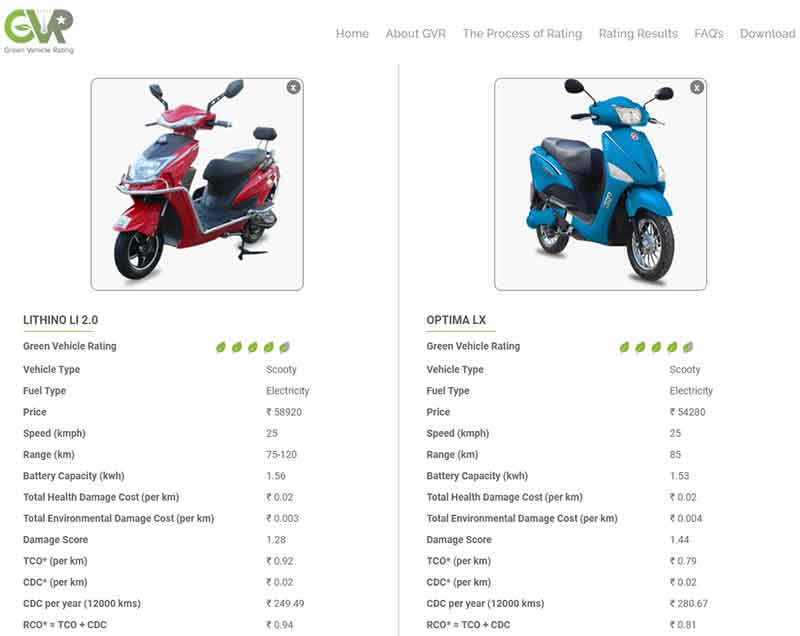 Figure 5: Snapshot of EV to EV comparison in the GVR website
3. ICE vs. ICE
Every ICE vehicle that is purchased is essentially locking up emissions across its life span. Consumers owing to their personal choice might be willing to buy an ICE vehicle, and their preferences regarding engine performance, mileage, among other factors, narrows down their pool of vehicle options. Such consumers can still avail GVR to help them decide on a relatively greener vehicle choice. As shown in Figure 6, the comparison of ICE to ICE vehicles enables the consumer to actively contribute to climate change mitigation efforts. The side-by-side environmental performance comparison of their preferred vehicles allows them to make a greener vehicle choice.
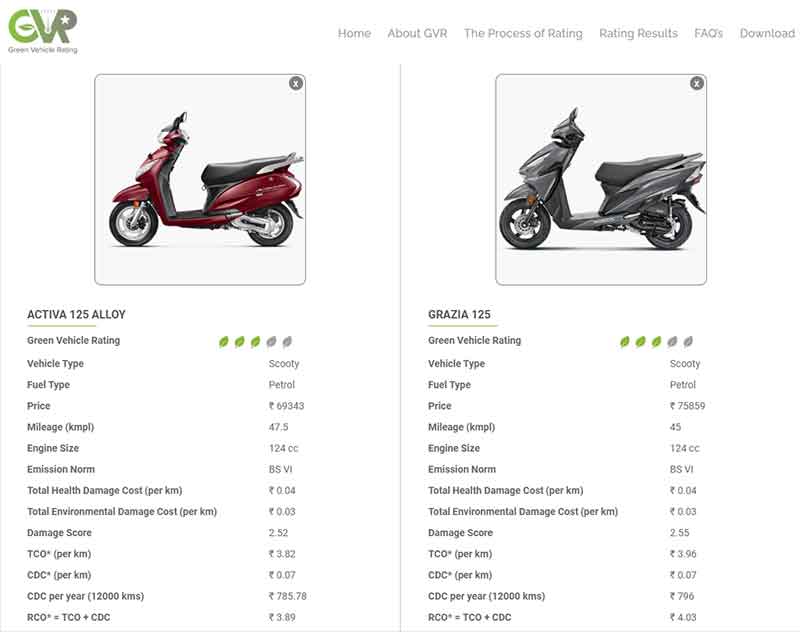 Figure 6: Snapshot of ICE to ICE comparison in the GVR website
Conclusion
There is no doubt that the supply and demand needs of the transport ecosystem must be nudged towards greener alternatives in the interest of a cleaner and efficient future. Critical information asymmetries exist concerning the health and environmental damages caused by automobiles. This gap warrants information tools to be provided to the consumer to make a greener vehicle choice within their financial capacity. Such a shift in demand will gradually open up avenues for automobile manufacturers to prioritise their vehicles’ efficiency, enable the government’s broader objective to promote e-mobility, and contribute to the Sustainable Development Goals (SDGs). In the long run, bridging such information gaps towards cleaner alternatives can ensure that the transport sector supports a sustainable future.
References
Climate Action Tracker. (2020). Decarbonising the Indian Transport sector.
Ghosh, A. (2020, January). How conscious consumerism is taking root in India. From World Economic Forum: https://www.weforum.org/agenda/2020/01/conscious-consumerism-is-taking-root-in-india/
Mordor Intelligence. (2021). INDIA ELECTRIC VEHICLE (EV) MARKET – GROWTH, TRENDS, COVID-19 IMPACT, AND FORECASTS (2021 – 2026). From Mordor Intelligence: https://www.mordorintelligence.com/industry-reports/india-electric-vehicle-market
SIAM. (2021). DOMESTICS SALES TRENDS. From Society of Indian Automobile Manufacturers: https://www.siam.in/statistics.aspx?mpgid=8&pgidtrail=14
This blog is written by Varun BR