“Is my electricity bill too high?” “Do I know how much electricity I am paying for?” “Can I access my electricity consumption data readily?” “How can I reduce my electricity bill?” “I wish I could access my electricity consumption data as readily as my mobile/internet data usage!”
We wonder how often Indian residential consumers think about their electricity bills – and about reducing them. India’s average per capita annual residential electricity consumption is just 20 kilo of oil equivalent (koe) i.e. less than 1/3rd of the world average of 68 koe and many times lower than US’ and China’s per capita annual residential electricity consumption of 384 koe and 61 koe, respectively. We would imagine, intuitively, that perhaps the average Indian residential consumer is not too bothered about their electricity bill (unlike in the cases of LPG, diesel, and petrol, where the price sensitivity is much higher). Additionally, in many cases, already low electricity rates, not prone to substantial annual increases, are further subsidised by state governments. Yes, the social media was abuzz with complaints from ordinary citizens as well as celebrities about inflated bills during the COVID-19 lockdown in 2020, but this might be just a slight aberration in an otherwise staid response to electricity bills. Of course, it is not intelligent to compare the Indian context with the American context, and for that matter even the Chinese context – after decades of stumbling economic growth, the fledgling Indian middleclass has emerged to a better lifestyle that can be enabled by electricity use. However, there is a strong argument for a more conscious use of electricity in Indian homes, considering that about 1/4th of India’s total electricity consumption, largely fossil fuel-driven, is consumed by the residential sector (second only to industries). The promise of a sustainable energy future must be viewed in the milieu of the changing climate (not just for the sake of India’s commitment to international multilateral agreements such as the Paris Agreement, but for the real climate vulnerabilities that will increasingly endanger the Indian people) and the grid impacts of steeper peak loads. With population, urbanisation, and economic growth, the imprint of the residential sector’s electricity consumption patterns will become stronger, particularly accentuated by the growing deployment of more and more room air conditioners in a warming climate by the aspirational middleclass. Can data become the underpinning essence of the funambulism described above – between economic maximisation and the fragility of the environment, between development and sustainability?
“What kind of data is available to Indian residential consumers on their electricity bills in different parts of India?”, “Is it enough?”, “What more should be made available to make consumers more aware of what they consume, to spur (at least) thought, if not action?” The Energy Data Services team of AEEE came together to compare their electricity bills from Kochi, New Delhi, and Kolkata – these bills looked different and presented different consumption metadata. Our curiosity about what kind of consumption data is made available to residential consumers by different DISCOMs led us to this exercise. We crowdsourced 30+ unique residential electricity full and spot bills for post-paid meters (after removing personal identifiers) from our generous AEEE colleagues and their friends and families from 20+ states and Union Territories of India.
At the very outset, we must confess that we were by and large proven wrong (gladly) about Indian DISCOMs’ (private and public) lackadaisical attitude towards their customers with respect to consumption data; we are unable to pin-point the origin of this myth or misconception (perhaps Indian DISCOMs’ ailing finances?), but our observations show that customers have the option to access adequate information about their current and past electricity consumption and bills through paper bills, emails, website portals, and DISCOM apps. Of course, there is scope for improvement, which we will be pointing out in this blog. Most DISCOMs have freely downloadable mobile phone apps which can be used to view monthly energy bills, pay bills, access consumption/bill history, manage complaints, and view outage information. Here are a few examples: CESCAPPS, eSampark Chandigarh, JKPDD BillSahuliyat GO, SUVIDHA, and JBVNL ezy-Bill. We cannot confirm if all these apps are available for iOS devices (they are certainly available for Android phones) and if they work seamlessly.
In more than 2/3rd of the detailed paper bills we looked at, at least some data on the past consumption trend was made available. This can be meaningful in helping consumers understand their consumption trends as a function of the changing season, one-off events, the addition of new appliances, home guest stays, etc. and making them more mindful of their consumption going forward. For example, bills by
- BSES Rajdhani Private Limited (BRPL), BSES Yamuna Private Limited (BYPL), BSES Yamuna Private Limited (TPPDL), Madhyanchal Vidyut Vitaran Nigam Ltd. (MVVNL), Uttar Haryana Bijli Vitran Nigam (UHBVN) display the last 6 months’ consumptions; Chandigarh Electricity Department and Uttar Haryana Bijli Vitran Nigam (UHBVN) display the last 6 cycles’ consumptions
- Kota Electricity Distribution Ltd. and Maharashtra State Electricity Distribution Co. Ltd. (MahaVitran) (Figure 2) display the last 12 months’ consumption
- Uttarakhand Power Corporation Ltd. displays the last 5 months’ consumption
- South Bihar Power Distribution Company Ltd. displays the last 11 months’ consumption.
About half the detailed paper bills showed the energy bill calculations per the LT tariff slabs and rates (besides calculations for fixed charges, government duty, etc.) (Figure 3). Detailed energy calculations per the tariff slabs and rates, can perhaps help consumers relate higher consumption with higher electricity rates and nudge them to stay below a certain slab – of course, real-time monitoring of consumption with the current metering infrastructure is not feasible, but it may still help inculcate energy conserving/efficient behaviours. Additionally, if Time of Day (ToD) rates are available, consumers can be nudged to shift flexible loads to off-peak times.
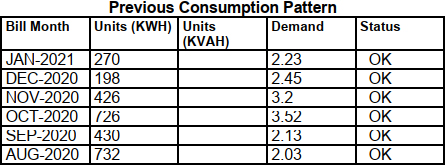 Figure 1: Six-month consumption trend shown in a bill by Madhyanchal Vidyut Vitaran Nigam Ltd. (MVVNL)
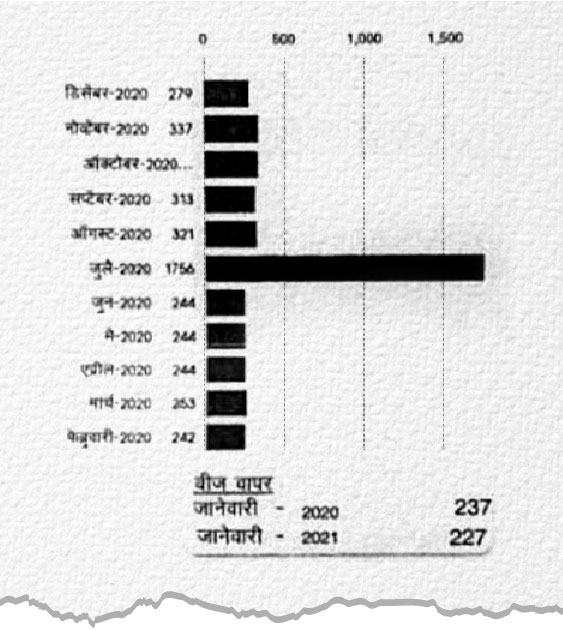 Figure 2: Twelve-month consumption trend shown graphically in a bill by Maharashtra State Electricity Distribution Co. Ltd. (MahaVitran) including a same month comparison for the present and the previous years
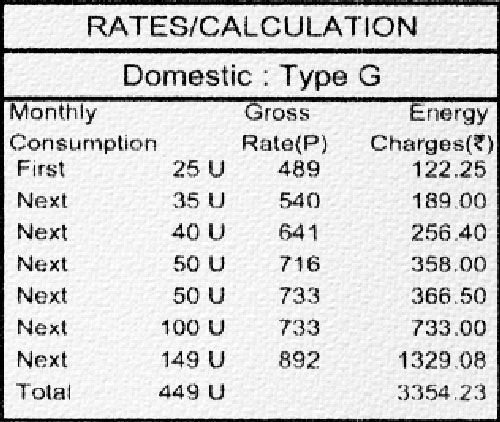 Figure 3: Energy bill calculations per the LT tariff slabs and rates in a bill by Calcutta Electric Supply Corporation (CESC)
Expectedly, spot bills do not contain as much information as full bills, especially in terms of consumption trends and energy bill calculations. We do not contest the utility of spot bills from the DISCOMs’ point of view (aside: a spot bill is generated using a spot billing machine; the meter reader enters the meter reading in the consumer’s premises and generates a bill and delivers it on the spot; payment can be received on the spot; it is a cost-cutting measure for the DISCOM since the work of a meter reader, a bill clerk and a despatcher is done by one person), but clearly some spot bills were more informative as compared to the others. For example, the spot bill generated by Assam Power Distribution Company Ltd. contained detailed energy calculations per the tariff slabs and rates (Figure 4); and the spot bill generated by Punjab State Power Corporation Ltd. contained the last 6 months’ consumption details (Figure 5). The other spot bills we perused lacking on both these fronts.
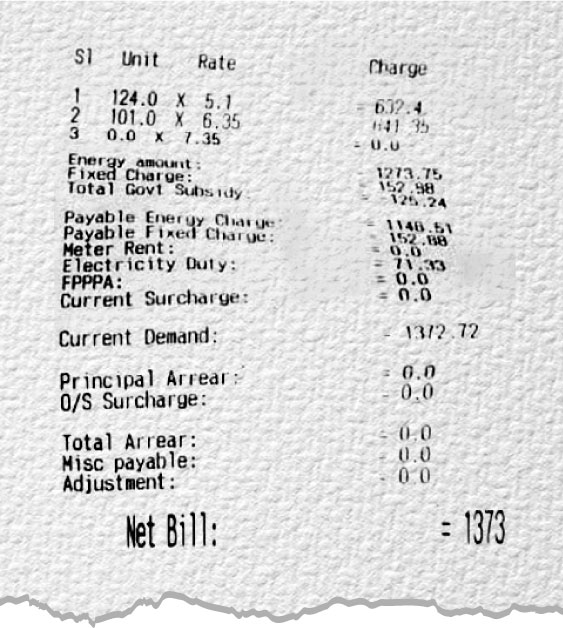 Figure 4: Energy bill calculations per the LT tariff slabs and rates in a spot bill by Assam Power Distribution Company Ltd.
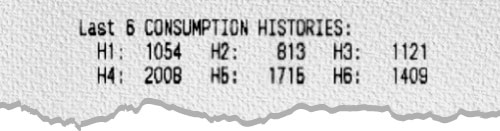 Figure 5: Last 6 months’ consumption details in a spot bill by Punjab State Power Corporation Ltd.
We probed a little further, this time on DISCOM websites, and were pleasantly surprised to find power consumption calculators on many websites – here the capacity and hours of use (in a month or day) of common household appliances such as air conditioners, air coolers, refrigerators, water heaters, washing machines, water pumps, lamps, fans, and computers, can be entered to calculate the estimated units per month. Whilst this is certainly a step in the right direction in terms of consumer awareness, we were slightly disappointed to notice that energy efficiency encapsulated in the BEE Star Rating of energy-intensive appliances such as air conditioners was not factored into these power consumption calculators – otherwise, curious customers could fiddle with these calculators to see for themselves the impact of higher BEE Star Rating appliances in lowering their monthly unit consumption, creating another way of engaging consumers. Interestingly, some DISCOM websites provide energy saving tips – examples include South Bihar Power Distribution Company Ltd. (which mentions adaptive thermal comfort “Operate the ceiling fan in conjunction with your window air conditioner to spread the cooled air more effectively throughout the room and operate the air conditioner at higher temperature” amongst other tips), Telangana Southern State Distribution Company, Madhyanchal Vidyut Vitaran Nigam Ltd. (MVVNL), BSES Yamuna Private Limited (TPPDL), TP Central Odisha Distribution Limited, etc.
Listed below are some good practices in DISCOMs’ billing services that we think can help make India’s residential consumer base more conscious of their electricity consumption, and subsequently more energy-efficient:
- An important institutional step would be to bring some level of nationwide standardisation among electricity supply codes of different states and a strict compliance of these standardised codes. For example, the electricity supply code of Tamil Nadu says “In case of low tension (LT) services, after taking the meter readings, the particulars of meter readings, energy consumption and charges payable will be incorporated in the consumer meter card…For LT services, entry in consumer meter card shall be the bill of demand and there will be no separate issue of bill.”; this is very different from the electricity supply code of Assam in which “Details of last six readings” is mentioned in a “representative list” of the billing details. Electricity supply codes should emphasise including not only the unit consumption but also the bill amount (since consumers are more likely to be alerted to the cost implication of their unit consumption) for the last 12 months/billing cycles with insightful graphical representations to help customers draw meaningful deductions from their consumption trends and billing history with the objective of becoming more mindful of their consumption going forward. Admittedly, a consumer can always log-in to their personal portals on their DISCOM website to view their billing history, but it would be nice to reduce the number of steps for the consumer – surely, not all consumers would be equally curious and take the extra step. At the very least, a scan QR code can be inserted into paper bills to quickly take customers to their consumption history. It would be great to include a short standard pitch on BEE Star Labelling in every detailed paper bill persuading customers to become more energy-efficient in their next purchase of those appliances that are mandatorily or voluntarily covered by BEE’s Standard & Labelling programme. This nationwide standardisation of state-wise electricity supply codes, in terms of the billing details required on electricity bills, may be considered by the Forum of Regulators, which helps harmonise regulations in the power sector.
- Spot bills provided by many DISCOMs can be vastly improved in terms of containing detailed energy calculations per the tariff slabs and rates and the unit consumption and the bill amount for the last 12 months/billing cycles.
- DISCOMs’ power consumption calculators should factor in energy efficiency of common household appliances while calculating the estimated monthly unit consumption; energy saving tips should be widened in their scope from just the use of current appliances to inform customers about energy efficiency and the BEE Star Label in an attempt to make their next purchase more informed and energy-efficient.
- Mobile telephony and WhatsApp services should be improved/introduced to engage with customers more easily on their electricity consumption.
- Although this would need an upgradation of the metering infrastructure, DISCOMs may consider kVA billing for high consumption residential customers.
We recognise that the transition from awareness to action will be a long haul, but it is worth improving the soft infrastructure around end-use energy data right away to steer the emerging Indian middleclass from imprudent development towards sustainable development. To this effect, the importance of detailed electricity bills – clearly, the most important (and sometimes only) way of engaging with consumers on their electricity consumption – will help residential consumers make more informed lifestyle choices and mainstream a culture of energy conservation and efficiency.
Acknowledgement: We wish to record our sincere thanks to all AEEE colleagues who helped us crowdsource the electricity bills that were perused for creating this blog.
Written by Akash Goenka with inputs from Priyami Dutta and Bhawna Tyagi
Akash divides his time between closing energy end-use data gaps and developing cooling action plan methodologies for developing countries. He is an Imperial College alumnus.