By Akash Goenka
The Challenge
I often turn to Project Drawdown to refresh my understanding of climate change and potential climate solutions. I read their inaugural body of work in 2018 and liked how it assimilated the length and breadth of climate solutions by using a common denominator i.e. their global GHG mitigation potentials. The updated edition, Drawdown Review, was released earlier this year. By definition, ‘drawdown’ is that future point in time when the global level of greenhouse gases in the atmosphere will stop climbing and start declining steadily. Clearly, the concept of drawdown is closely tied to the concept of peaking. The term ‘peaking’ has especially caught on in a pandemic world, wherein a lot of the conversation revolves around when the COVID-19 infection rates will peak and then start falling.
I like the use of innovative graphs and charts and the storytelling that goes with it in Drawdown Review. Let us understand global warming with the aid of a schematic by from this publication (Figure 1):
- Heat-trapping gases, including carbon-dioxide, methane, nitrous oxide, and fluorinated gases, from various sources, are emitted into the atmosphere. The distribution of greenhouse gases by the source as shown in the schematic include greenhouse gases emitted onsite/directly into the atmosphere. For example, the 6% of emissions attributed to buildings only account for fuels burned onsite for cooking, heating, etc.; emissions due to the use of electricity in buildings are counted within the electricity sector.
- Plants, soil, and the oceans, lower greenhouse gases in the atmosphere by roughly 40% through natural chemical and biological processes.
- Approximately 60% of heat-trapping emissions stay in the atmosphere and cause warming over time.
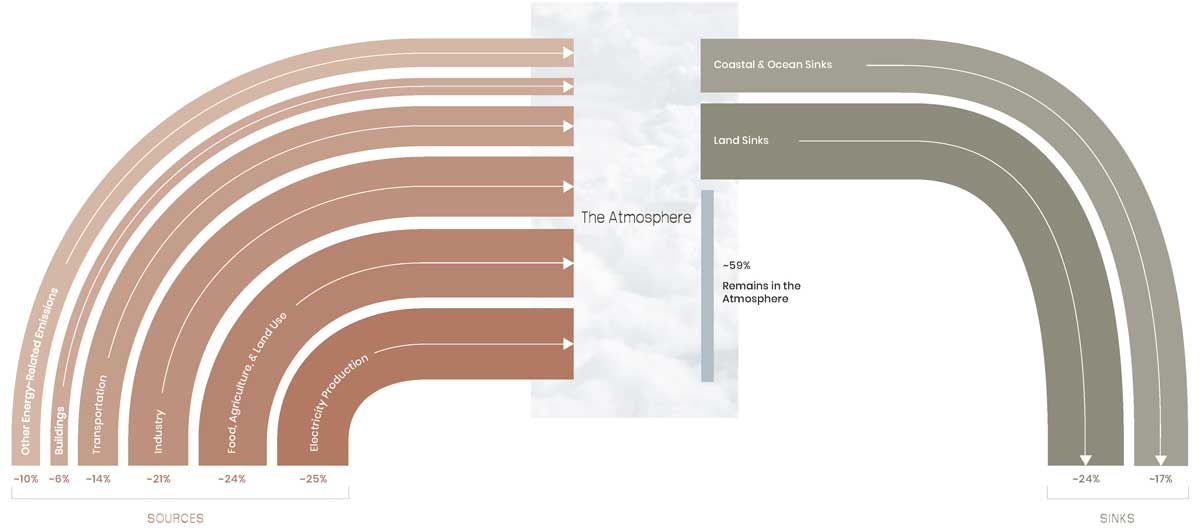
Figure 1: A schematic representation of the climate challenge
(Source: Project Drawdown, 2020)
Figure 1 shows the share of the global greenhouse gas emissions by source – I was curious to find out what India’s emission sources are like, and I dug out two sets of numbers. The first, shown in Figure 2, is by The Carbon Brief, and the second, shown in Figure 3, is by IEA. Figure 2, shows carbon dioxide from fuel combustion (in buildings, transport, industry, and for power and heat) and non-combustion sources (industrial process emissions, agriculture, and waste); the values for methane, nitrous oxide, and fluorinated gases cover all sectors, particularly land use, land-use change, and forestry. Figure 3 depicts only carbon dioxide from combustion sources and aligns well with the corresponding numbers from Figure 2. Based on the IEA numbers, India, which houses 17.7% of the world’s population, emitted only 6% of the world’s carbon dioxide emissions in 2016; China and the US’s emissions were 4.4X and 2.4X times those of India.
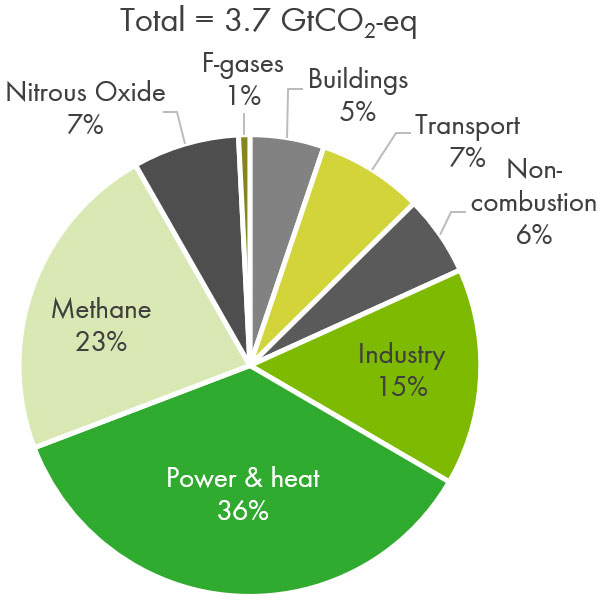
Figure 2: 2016 GHG emissions by source
(Source: The Carbon Brief, 2020)
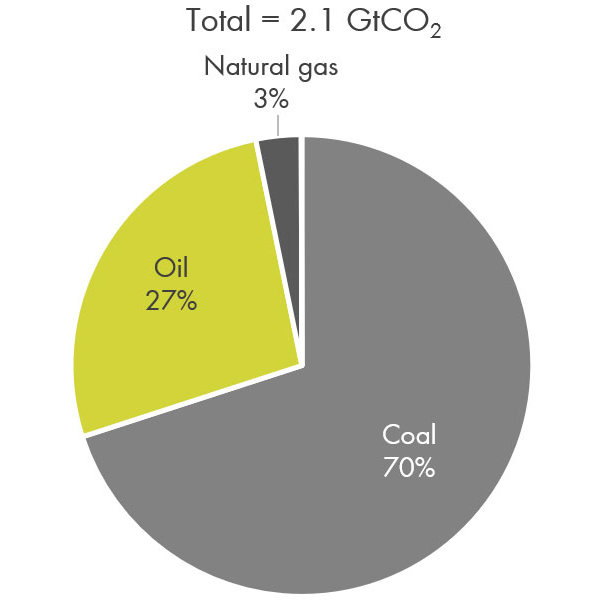
Figure 3: 2016 CO2 emissions by fuel combustion (only)
(Source: IEA, 2020)
India’s disproportionately low carbon dioxide emissions, when compared to emissions by China and the US, warrant a relook at the principle of Common but Differentiated Responsibilities enshrined in the United Nations Framework Convention on Climate Change (UNFCCC) that acknowledges the different capabilities and differing responsibilities of individual countries in addressing climate change.
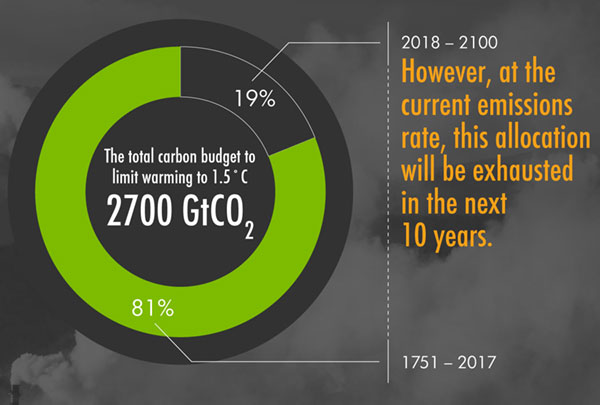
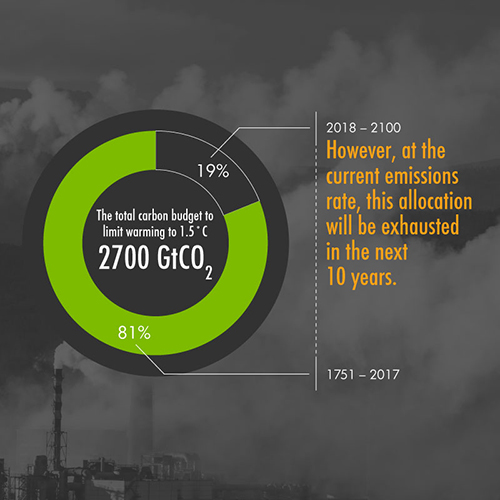
Figure 4: The carbon budget to limit warming to 1.5˚C
(Source: CSE, 2019)
Figure 4 shows that the world had already exhausted 80% of its carbon budge between the dawn of the industrial revolution and 2017. Only the remaining 20% of the carbon budget should be emitted till the end of this century to limit temperature rise to 1.5˚C. However, at the current emissions rate, this allocation will be exhausted in the next 10 years.
Figure 5 shows that the historical division of the carbon has been extremely inequitable, especially if considered in light of the countries’ populations. The US and Europe, which currently constitute roughly 15% of the world’s total population, are responsible for nearly 50% of the historical emissions.
Figure 6 depicts that this inequity is likely to persist in the future, with China as the leading polluter. China, EU, the US, Japan, and Russia, with just 1/3 of world’s population, will consume nearly half of the future carbon budget. The status quo shows that while Common but Differentiated Responsibilities is a noble and just guiding principle, it has now lost its relevance, especially in view of China’s changing position in the world. Of course, China’s ambitious announcement to go carbon-neutral by 2060, though promising, has left many questions unanswered: Bloomberg Green reports that “China is the world’s largest energy user and greenhouse gas emitter, mines and burns half the world’s coal, and is the top importer of oil and natural gas. Transitioning that economic behemoth to carbon-neutrality within a few decades could cost $5.5 trillion” and “require the deployment of technologies that are barely in use today.”
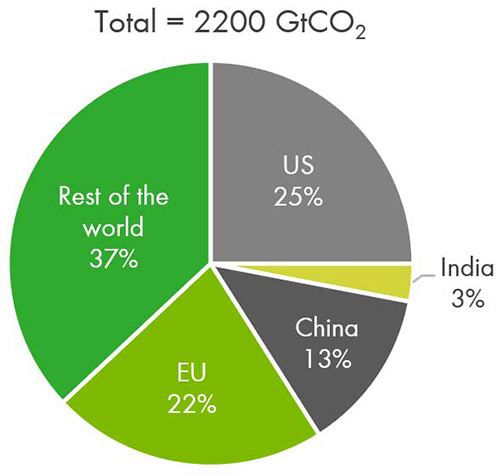
Figure 5: Historical (1751-2017) emissions by country
(Source: CSE, 2019)
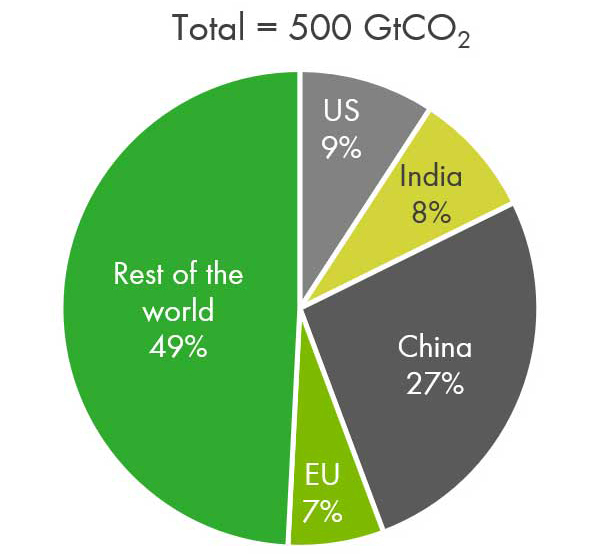
Figure 6: Future (2018-2100) emissions by country
(Source: CSE, 2019)
In terms of the peaking of GHG emissions, Figure 7 presents some of the key findings from a 2017 study – while newer data might be available, these numbers are still helpful in understanding GHG emissions peaking. By 1990, many East European and Central Asian countries peaked; by 2000, many West European and Nordic countries peaked; the US, Australia, etc. peaked by 2010; China has committed to peaking by 2030; and India hasn’t made a commitment around the peaking year. While this could be apparently heartening, it is important to note that a large number of countries, particularly in the developing world, have still not peaked; moreover, the emission levels at which some countries have peaked is far from sufficient to meet the Paris Agreement’s temperature goals to limit warming to well below 2˚C, with an effort to limit warming to 1.5˚C by the end of the century. We have already used up 1˚C of this total allowable rise.
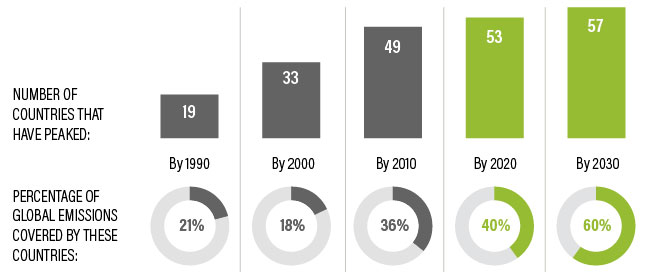
Figure 7: Some key numbers related to emissions peaking
(Source: WRI, 2017)
A combination of numbers by Prof. James Hansen and by NASA, 2020 can illuminate the worsening climate crisis. Between 1950 and 2000, carbon dioxide concentration grew at 1.8 ppm/per year. Between 2000 and 2020, carbon dioxide concentration grew at 2 ppm/per year – the present anthropogenic increase in carbon dioxide concentration is 20,000X its natural forcing in the atmosphere – this is a sobering number. Between 2020 and 2050, carbon dioxide concentration is expected to grow at >4 ppm/per year. Clearly, it will become progressively difficult to reach drawdown with every passing year, while complying with the Paris Agreement’s allowable temperature rise goals.
The Solution
If the climate challenge is clearly understood, the solutions too will reveal themselves: reduce emissions at source and support sinks to uplift the natural carbon cycle, all while minimising social inequity and meeting development goals.
Project Drawdown presents the GHG mitigation impact of climate solution along two scenarios. Scenario 1 (the relatively easier one to achieve) roughly aligns with the IPCC 2°C rise, whereas Scenario 2 roughly aligns with the IPCC 1.5°C rise (Figure 8). While the difference between 1.5°C rise and 2°C rise isn’t seemingly much, the IPCC 2018 special report emphasises that these two scenarios are vastly different from each other in terms of extreme heat, sea-level rise, species loss, ecosystem damage, and more. In Scenario 1, peaking would happen in 2050 at 540 ppm, whereas in Scenario 2, peaking would happen in the mid-2040s at 460 ppm.
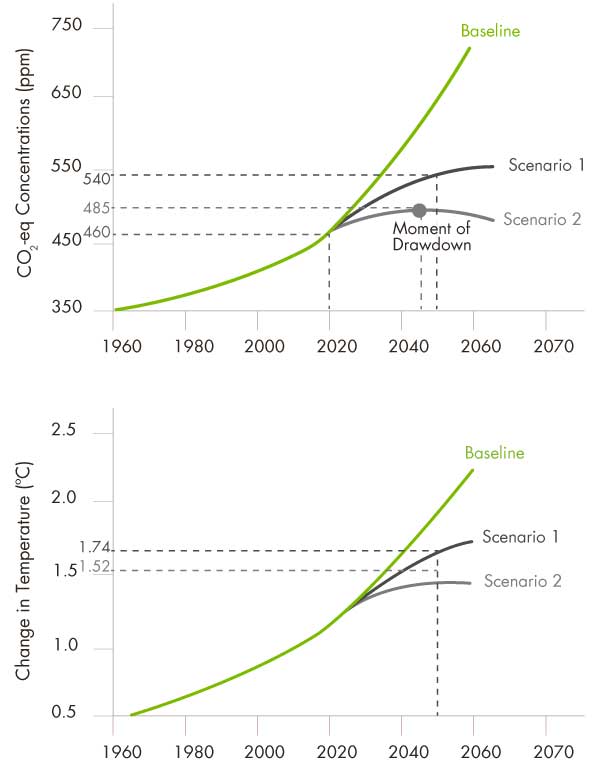
Figure 8: Potential drawdown scenarios
(Source: Project Drawdown, 2020)
Figure 9 demonstrates the global GHG mitigation potential of demand-side climate solutions over a 30-year timeframe. These are not all the solutions (just the demand-side ones), and account for 25%-30% of the GHG mitigation required for drawdown. The impact of these solutions is measured in GtCO2-eq mitigated over 30 years from 2020 to 2050.
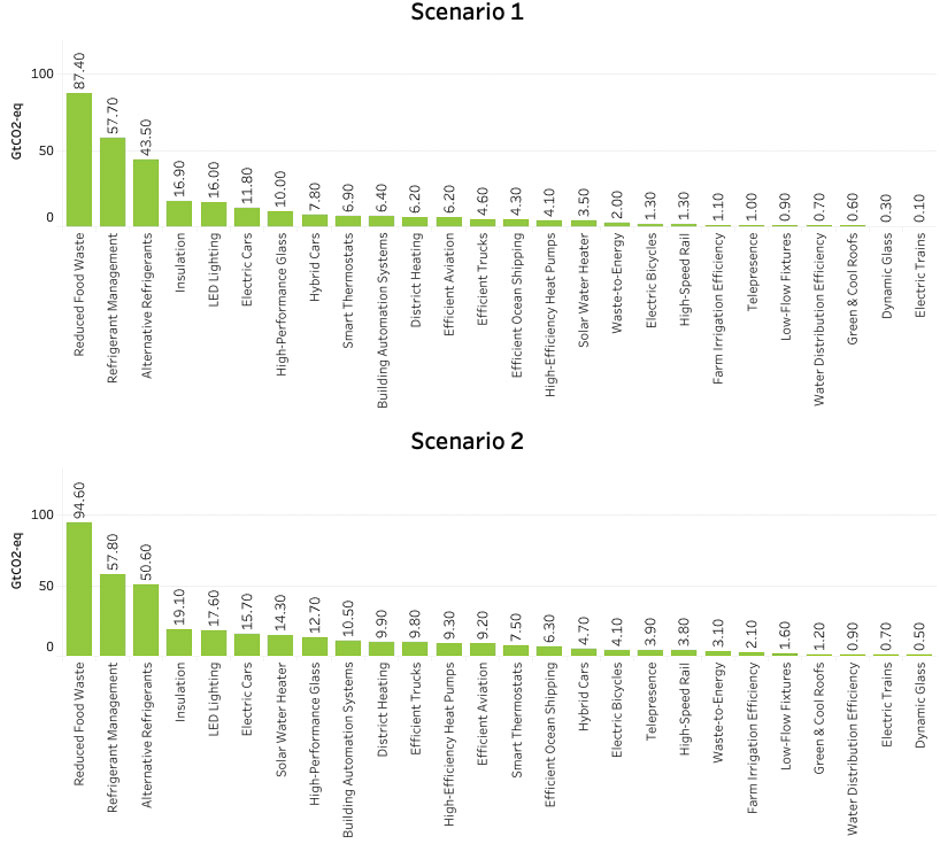
Figure 9: Global GHG mitigation potential (2020-50) of demand-side climate solutions
(Source: Project Drawdown, 2020)
[Note: Emission reductions enabled by distributed energy storage, grid flexibility, microgrids, utility-scale energy storage is allocated to electricity generation solutions and not shown here.]
Here are my observations from the findings presented in Figure 9:
- It is surprising not to see cooling energy efficiency (in buildings, cold-chain, refrigeration, mobile AC, industrial cooling, etc.) as a standalone solution. Perhaps efficient cooling deserves its place in the discourse in an increasingly warming world, considering that, per research by RMI, the projected growth in room air conditioners alone amounts to 10 new ACs sold every second for the next 30 years; also, national cooling action plans are being developed the world over to steer the future of cooling towards sustainability. Regardless, what is still interesting is that the 6 of the top 10 most impactful solutions intersect with cooling – this should reaffirm India’s strategic focus of elevating sustainable cooling to a national priority in the India Cooling Action Plan 2019.
- Per Project Drawdown ‘reduced food waste’ entails land and resources used and greenhouse gases emitted in producing food not eaten. It is important to understand this more deeply – once we produce food, there are two levels at which wastage occurs. Per FAO, ‘food loss’ happens due to managerial and technical limitations, such as a lack of proper storage facilities, cold chain, proper food handling practices, infrastructure, packaging, or efficient marketing systems; whereas ‘food waste’ is the removal from the food supply chain of food which is still fit for human consumption.
- So, food waste typically but not exclusively happens at the retail and consumer levels whereas food loss takes place at the earlier stages of the food supply chain – during production, post-harvest and processing stages. An article in Financial Times explains that the food value chain accounts for 20%-37% of global emissions, out of which 5%-10% is beyond farm gate including storage, processing, transport, and retail. As is being discussed in light of the recent farmer law amendments, millions of India’s smallholder farmers do not have access to post-harvest management facilities, such as cold storages, which shortens the lifespan of their produce leading to significant loss in produce value and in income for farmers – besides enhancing farmers’ welfare and supporting India’s food security goals, it is also important to view the need for a robust, uninterrupted, and energy-efficient cold-chain to avoid the GHG emissions due to the food lost before cooking. These linkages have been alluded to in the India Cooling Action Plan 2019.
- Refrigerant management and alternative refrigerants are hugely important. It brings to the fore the Montreal Protocol for phasing down and phasing out high-GWP refrigerants and the Kigali Amendment to the Montreal Protocol, which promotes harmonising energy efficiency with the ongoing refrigerant transition, which is the underpinning theme of the India Cooling Action Plan 2019.
- Telepresence, the work arrangement many of us are in presently due to COVID-19 related restriction, should be considered as a more permanent and climate-friendly option wherever/whenever possible.
- India has a robust policy infrastructure in place that intersects with other demand-side solutions such as insulation, LED lighting, electric cars, and high-performance glass. The on-ground implementation of these policies have seen varying degrees of success.
As I draw this blog to a close, I am wondering if I have overwhelmed you with data and left you confused – if I have, this is not my shortcoming alone, and is a limitation that even the IPCC is often accused of. Whilst the academic rigour of the IPCC is commendable, the jury is out on whether it has served its true purpose of positively influencing policymakers. Clearly, there is an urgent need for a paradigm shift in how we communicate the climate crisis to people – maybe through film, art, literature, music, or what have you, rather than the threat of imminent doom narrated using hard numbers? New research by Stanford, and seconded by Yale, has found that the number of Americans who feel passionately about climate change is rising sharply, and the issue appears likely to play a more important role in this year’s election than ever before. Perhaps, previously unbelieving Americans have now started understanding climate change, especially as they face the early onset of its effects – Hurricane Laura that smashed parts of Louisiana and Texas, leaving widespread wind damage; sweltering heat that triggered power outages across California; Californian wild fires, etc.
The question that remains unanswered is “When will climate action become an election agenda in India?” Even if it does, it will be inevitable to change perceptions at the individual level to drive swift and effective change to compensate for less than efficient implementing institutions and agencies.
PS: I am not an expert on climate change. However, the changing climate, its causes, its effects, and the solutions, have been closely interwoven into my academic and professional training in the last 5+ years. Moreover, I find myself passionately thinking about it, especially in the milieu of a barrage of recent and emerging news on climate change-induced erratic weather, wildfires, heatwaves, storms, floods, polar melting, the rising sea levels, and the general loss of lives and livelihoods. I was in my family home in Calcutta, when Cyclone Amphan ravaged through my city and the adjoining settlements in May 2020. Sheltered by privilege, I only suffered the loss of a stable Wi-Fi connection for a couple of weeks. But I am aware of the unimaginable destruction left in the wake of the cyclone, especially in the Sundarbans region, which typically forms the first line of defence against tropical cyclones that originate over the Bay of Bengal. Whether Cyclone Amphan was worsened by climate change, I am not sure – at any rate, this was the first time in recent memory, I felt the ‘fury of nature’ (albeit from behind the protective walls of my home) and became acutely aware of what climate change can do within my expected lifetime.
Akash is a Senior Research Associate at AEEE. He divides his time between closing energy end-use data gaps and developing cooling action plan methodologies for developing countries. He is an Imperial College alumnus.